Credijusto / Covalto
Redesigning a Multi-product Website
Building Credijusto's first website in 2020, then growing it through a bank acquisition and a full rebrand into the shared design system that still powers Covalto today.

- 79.36% → 64.43%
- bounce rate
- 0.06% → 1.66%
- conversion
My role
UX product designer. I set up the information architecture, the product vision and timeline, and a template every product could reuse, and I pushed for decisions based on data.
The squad
Three full-stack developers, a product manager, a content designer and a junior UX designer, plus a UX researcher.
The result
Conversion went from 0.06% to 1.66%. Bounce rate fell from 79.36% to 64.43%. One design system now backs every product.
One website for two companies
I built Credijusto's first website in 2020, when the company only had two products, Crédito and Leasing. Credijusto was a SOFOM then, a lender that wasn't a bank. In 2021 it acquired Banco Finterra and became the first fintech in Mexico to buy a licensed bank. By 2022 the two companies were folding into one identity: Covalto.
That meant two companies, two platforms and two sets of patterns that all had to become one site. Moving between products sometimes felt like visiting a different company, because in some cases it was. Every new feature meant solving a problem another team had already solved. The gap showed up in the numbers too. Getting an initial quote took ten days. A direct competitor did it in six minutes.
The first site had been built by a developer with no design experience, and nobody was measuring anything. Stakeholders weren't used to working in an agile way or deciding with data, so I also had to help the team start working that way.
What we set out to do
The goal was a modular site that could take new products as the company grew. It had to bring several products together, use the product catalog to understand users better, raise conversion, refresh the branding and design system, and give us metrics to compare release after release. The project ran in two releases: one to stabilize the site and one to add metrics.
Looking at how everyone else did it
I started with a benchmark of fintechs and banks. Their sites were alike: similar sections, and an online loan application in every one. On my scoring matrix, the best experience and ours were only 50 points apart.
Two things came out of it. I needed a separate benchmark for online loan simulators, and I wanted to test the information architecture and the content hierarchy with real users, because those two would be the backbone of the project.
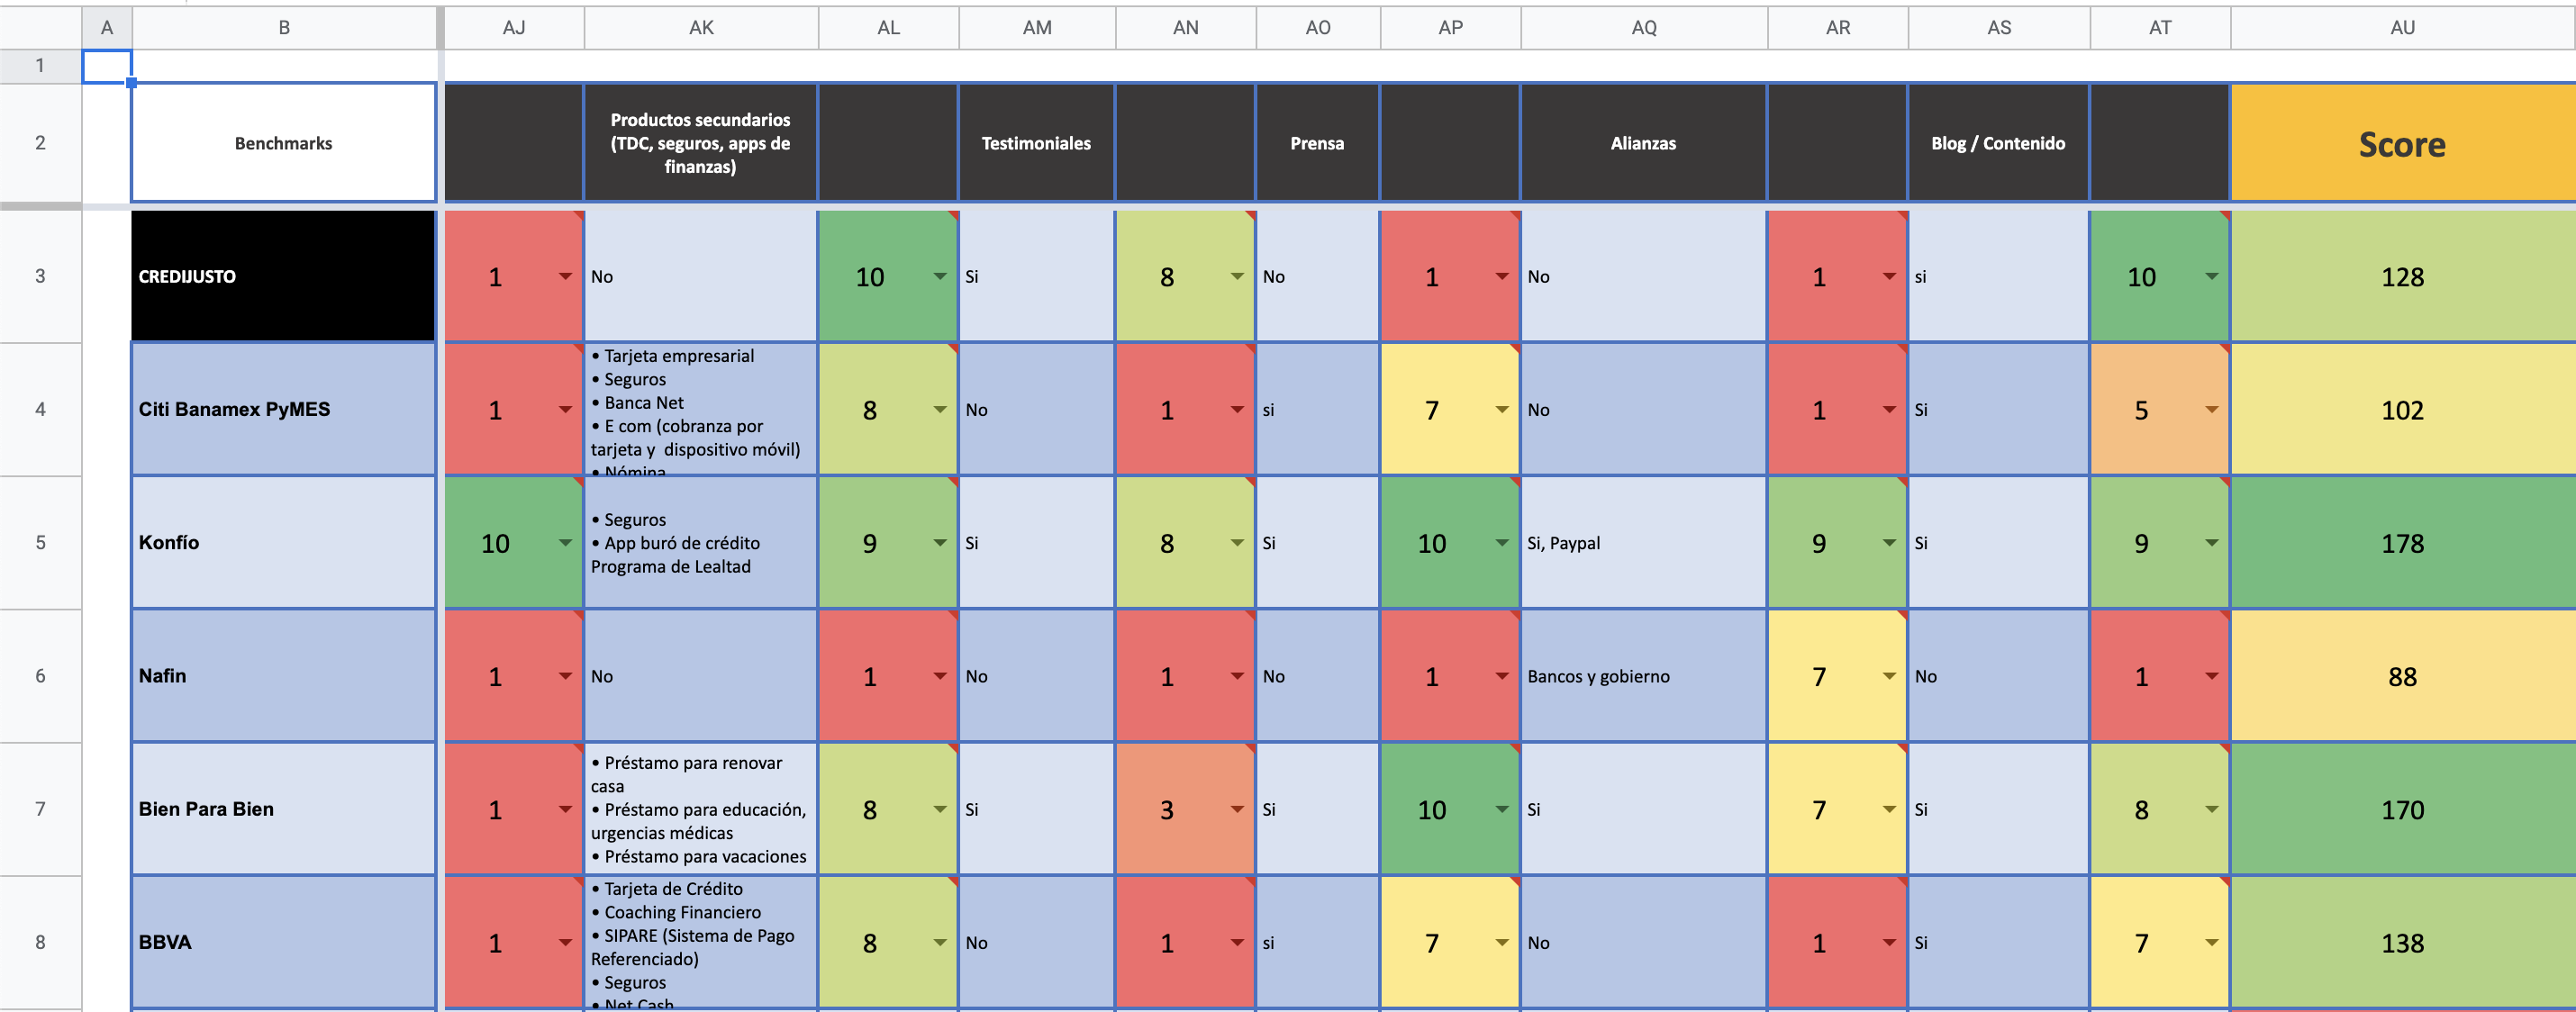 Screenshot of a benchmark spreadsheet that scores competitors on website features, each rated 1 to 10, with a total Score. Visible columns: secondary products (credit cards, insurance, finance apps), testimonials, press, partnerships, blog and content, and Score. Scores: Credijusto 128, Citi Banamex PyMES 102, Konfío 178, Nafin 88, Bien Para Bien 170, BBVA 138. Cells run from red for low ratings to green for high.
Matrix benchmarking based on a score.
The loan simulator
The simulators taught me three things. They help profile the customer, they work best when they explain what happens in each phase, and they have to work on mobile first. If a simulator feels attractive it can bring in leads, and it can give us a database of customer profiles.
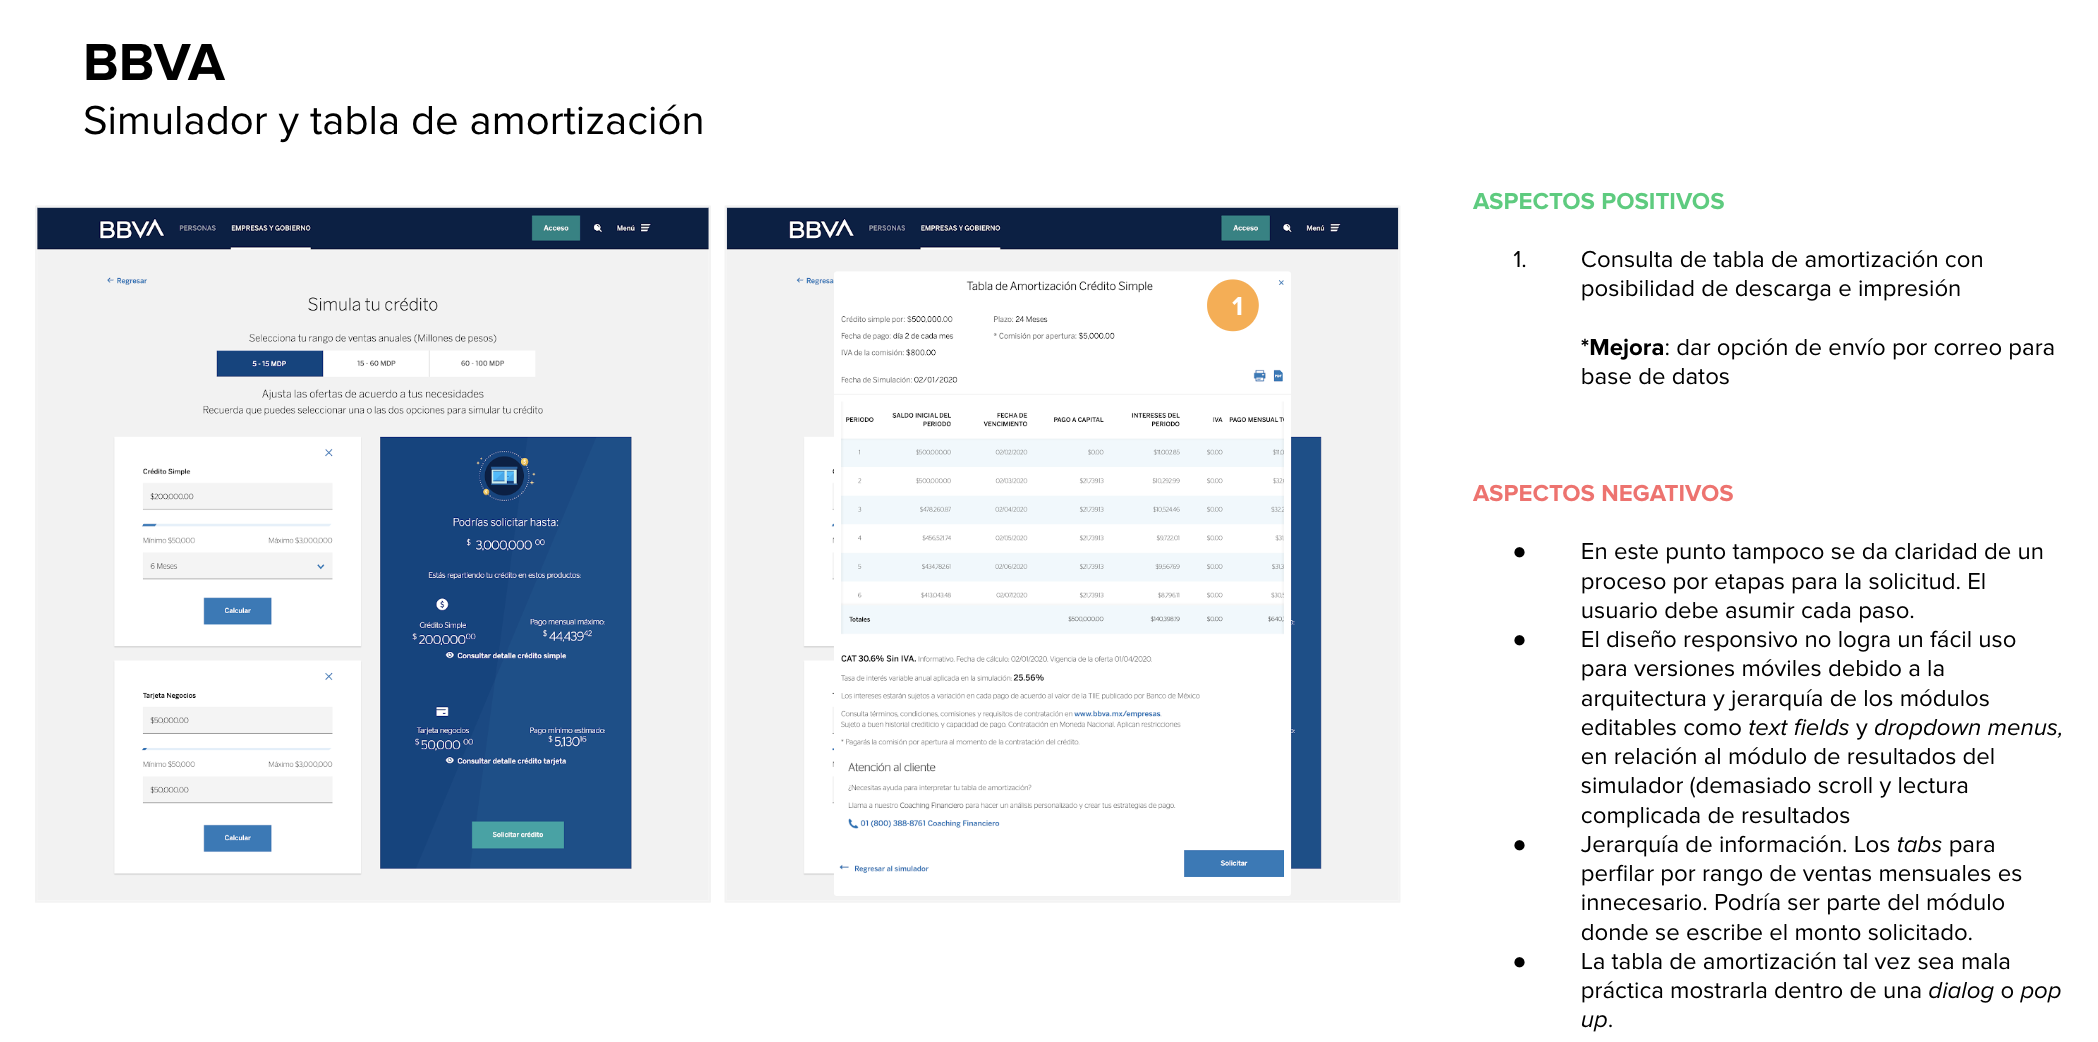 Slide titled BBVA, Simulador y tabla de amortización, with two screenshots of BBVA's business loan simulator and its amortization table, and notes in Spanish. Positive: the amortization table can be downloaded and printed. Suggested improvement: add an option to send it by email to build a database. Negative: the process is not shown as stages, so the user must assume each step; the responsive design is hard to use on mobile because of how the editable modules (text fields, dropdowns) are arranged next to the results, with too much scrolling and complicated reading; the tabs for profiling by monthly sales range are unnecessary and could be part of the module where the amount is entered; showing the amortization table inside a dialog or pop-up may be bad practice.
Example simulator from the benchmark.
Listening before drawing anything
In August 2021 we ran a workshop called "Experiencia Covalto (Finterra-CJ)". Its main line of action was to homologate the Finterra and Credijusto experiences into Covalto, and an MVP of a client portal came out of it as a named deliverable. I also mapped every cross-product user journey, to find where the inconsistencies cost users time.
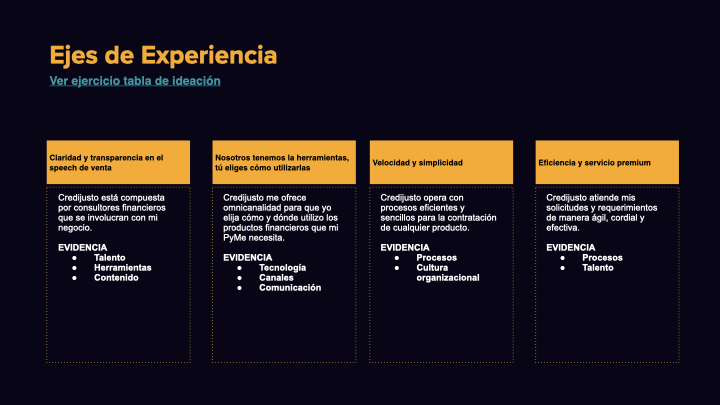 Slide titled Ejes de Experiencia (experience axes), with four columns. Claridad y transparencia en el speech de venta: Credijusto is made up of financial consultants who get involved with my business. Evidence: talent, tools, content. Nosotros tenemos las herramientas, tú eliges cómo utilizarlas: Credijusto offers omnichannel so I choose how and where I use the financial products my SME needs. Evidence: technology, channels, communication. Velocidad y simplicidad: Credijusto runs efficient, simple processes to contract any product. Evidence: processes, organizational culture. Eficiencia y servicio premium: Credijusto handles my requests and requirements in an agile, cordial and effective way. Evidence: processes, talent.
Experience axes from the August 2021 workshop.
Product decisions were still driven by "I think". The research changed that: shadowing, focus groups and surveys, plus four rounds of usability testing with real customer segments. The discovery work also reached leadership, who shadowed sales calls and sat in on customer conversations. It replaced assumptions with one shared, prioritized list of real pain points, and it gave the design system project the executive backing it needed to stick.
Redrawing the map
The 2020 site only held two branches, Crédito and Leasing, and they weren't built the same way. Crédito had its own Simulador and Solicitud flows that Leasing never got, and reaching either one meant going through a generic Menu Principal step that didn't match anything a customer would call a product.
By the time the site had grown into Créditos, Cuentas, Inversiones, the Covalto app, Factoraje, Arrendamiento and Fiduciario, that shortcut would have meant seven teams inventing seven versions of the same problem. The new structure drops the generic step. Every product gets the same shape, and all of them lead into one shared client portal.
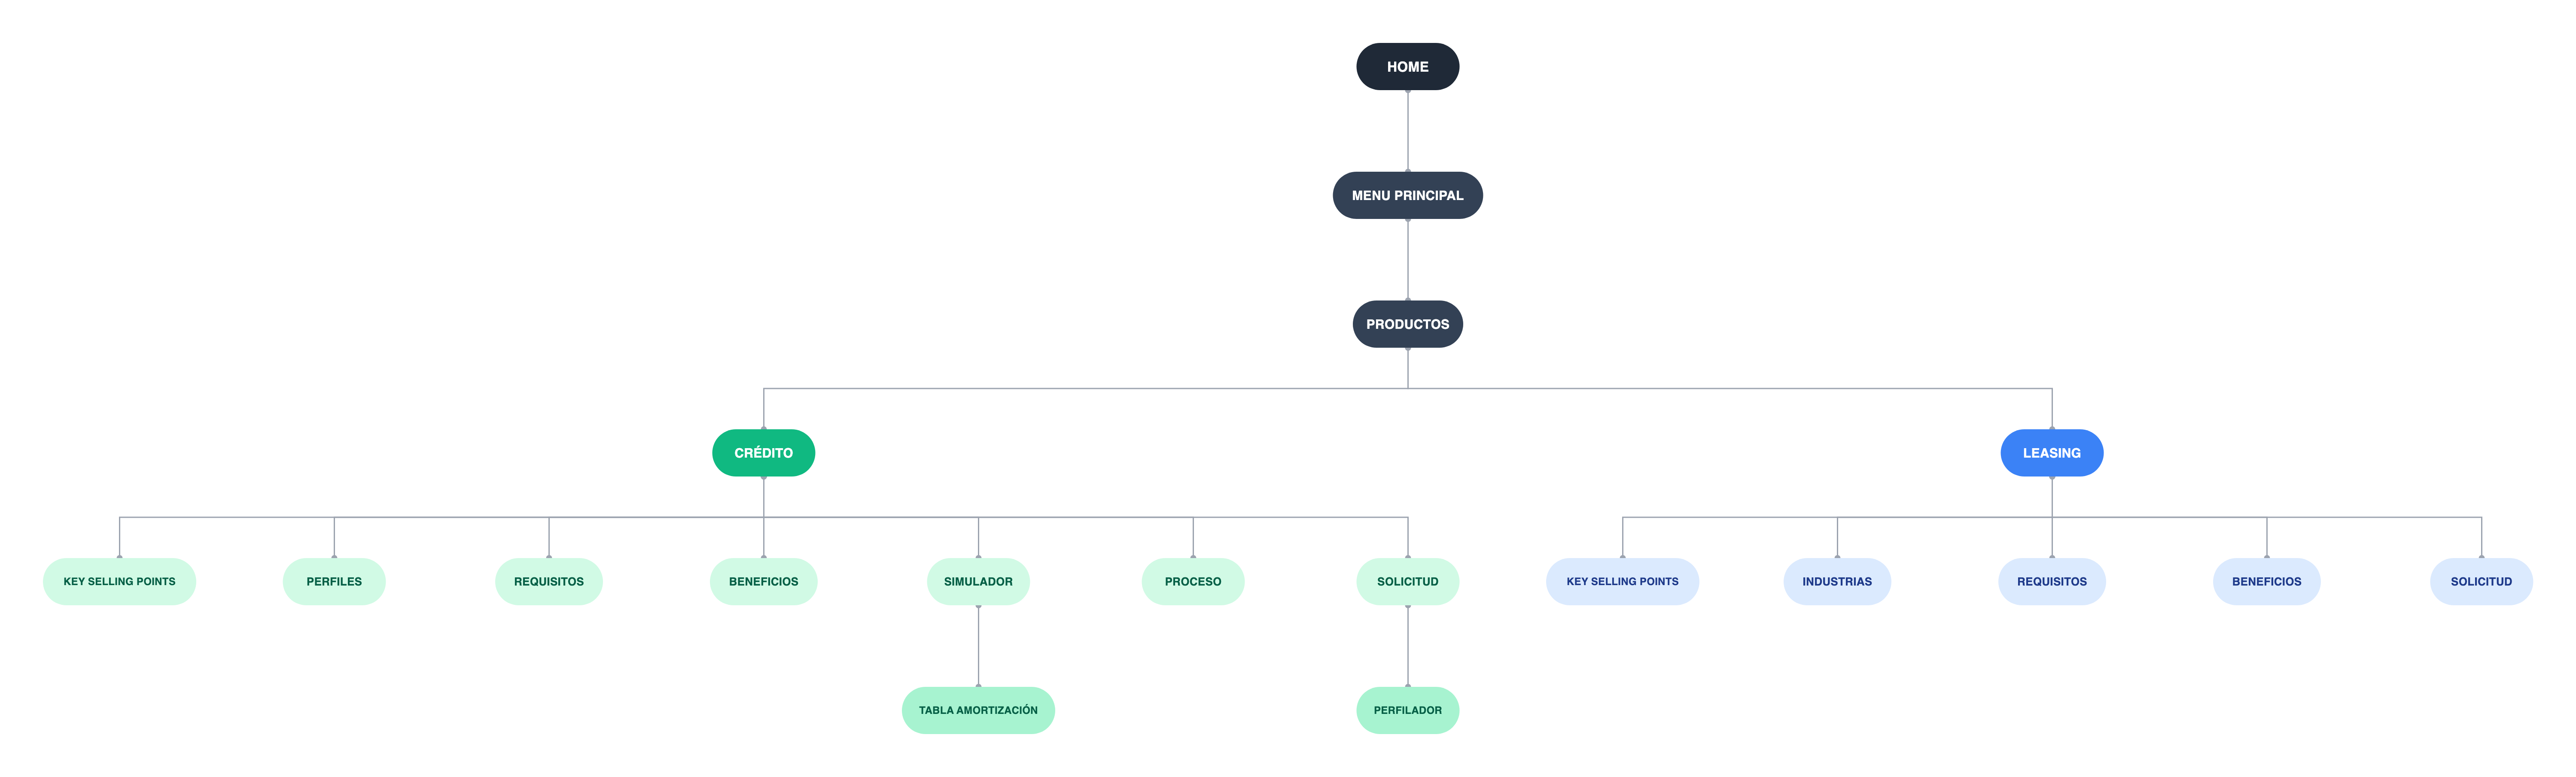 Site map of the 2020 Credijusto site, drawn as a tree. Home leads to Menú principal, then Productos, which splits into Crédito and Leasing. Crédito has seven pages: key selling points, perfiles, requisitos, beneficios, simulador, proceso and solicitud. Simulador leads to a tabla de amortización page and Solicitud leads to a perfilador. Leasing has five pages: key selling points, industrias, requisitos, beneficios and solicitud.
The 2020 site.
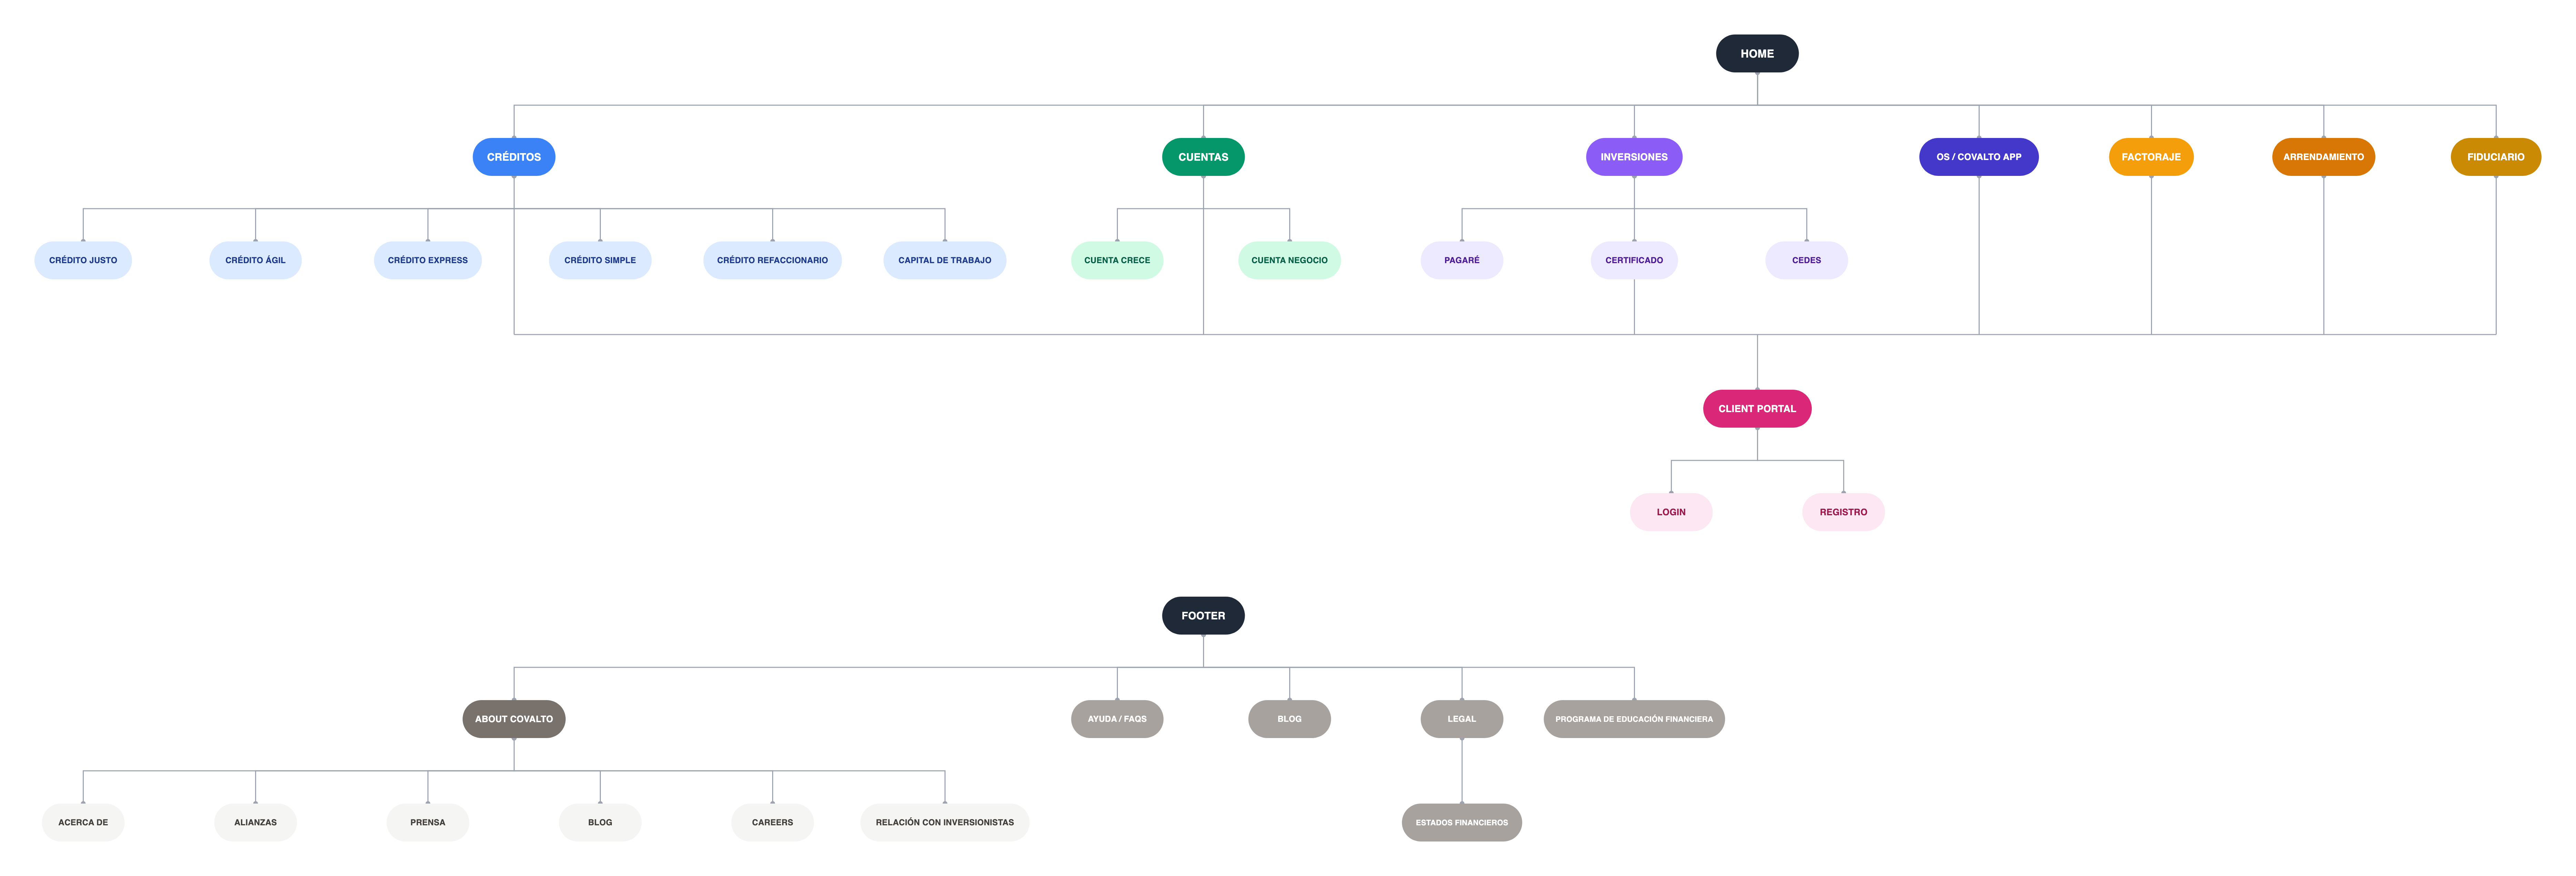 Site map of the redesigned Covalto site, drawn as a tree. Home leads to seven sections: Créditos (Crédito Justo, Crédito Ágil, Crédito Express, Crédito Simple, Crédito refaccionario, Capital de trabajo), Cuentas (Cuenta Crece, Cuenta Negocio), Inversiones (Pagaré, Certificado, Cedes), OS / Covalto App, Factoraje, Arrendamiento and Fiduciario. They all connect down to a Client portal with Login and Registro. A separate Footer branch has About Covalto (Acerca de, Alianzas, Prensa, Blog, Careers, Relación con inversionistas), Ayuda / FAQs, Blog, Legal (Estados financieros) and Programa de educación financiera.
The redesigned site.
Building blocks instead of pages
After the benchmark I stopped thinking in pages. I defined components for each module, so a module could be reused and the next page would take less time. To stop teams from reinventing basic components, I built Minerals, our shared pattern library. By Minerals 4.0 in March 2022 it already included the Covalto app components, which showed that it could hold both companies' products. I also reconciled competing conventions between teams, the same concept with different names and behaviors, and ran sessions with each product team to explain the reasoning, so adoption would stick.
The legacy pages show why this was needed. These three have different headlines, layouts and imagery, and nobody decided that on purpose. Across the growth program, the internal tools and the flagship app there were 21 products, and no component had all of its states documented. Engineering wrote a fresh version of the same component for nearly every project.
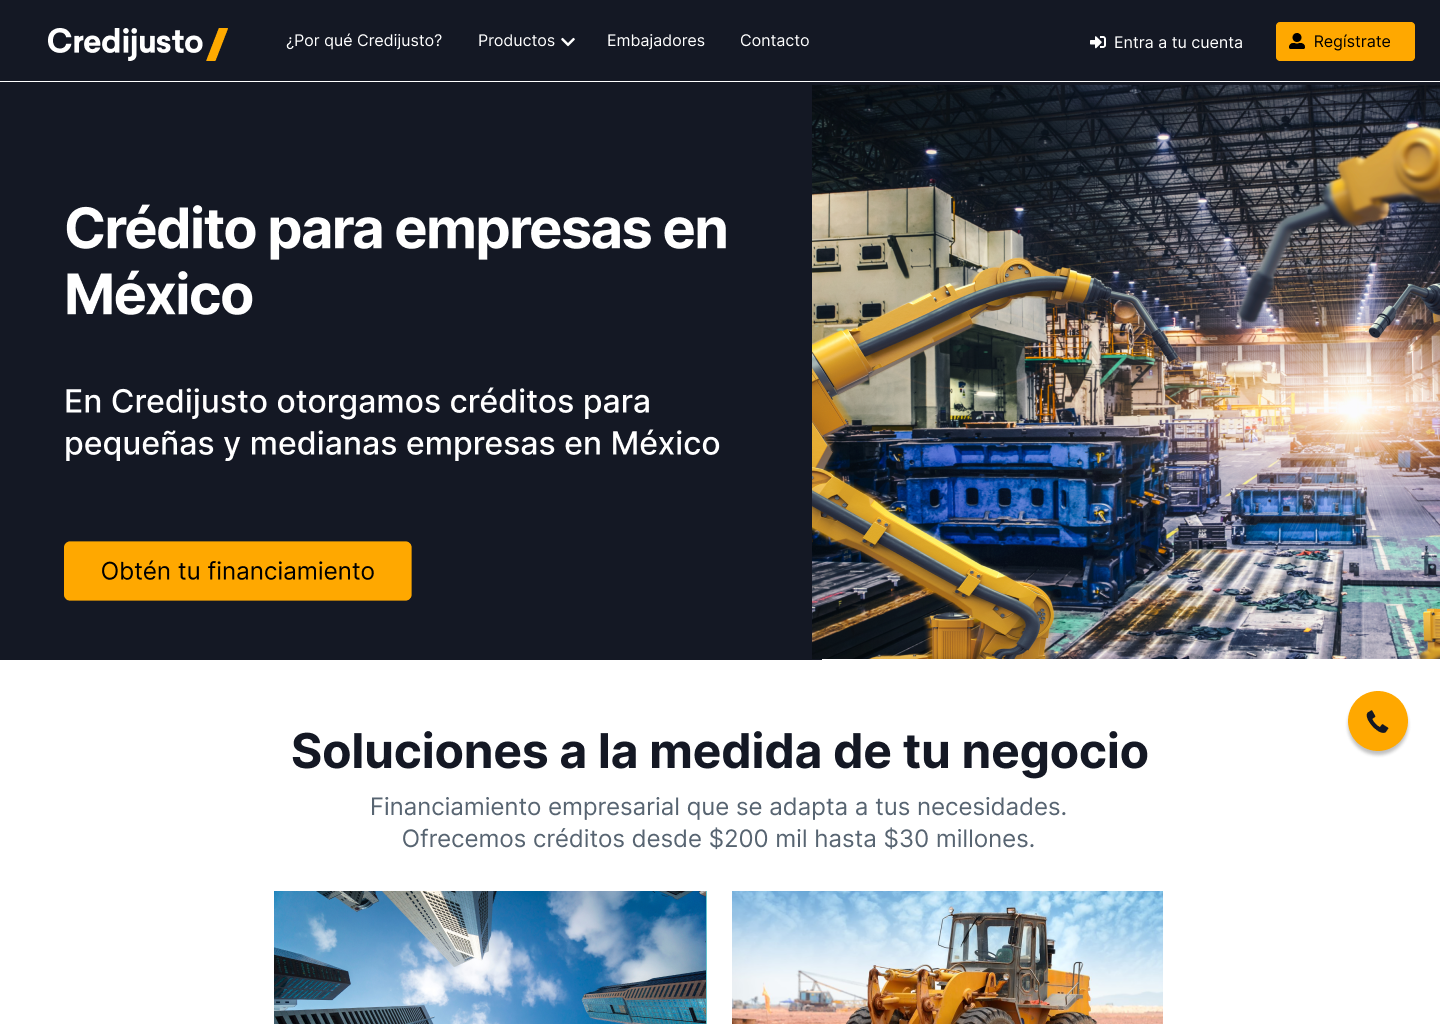
Home
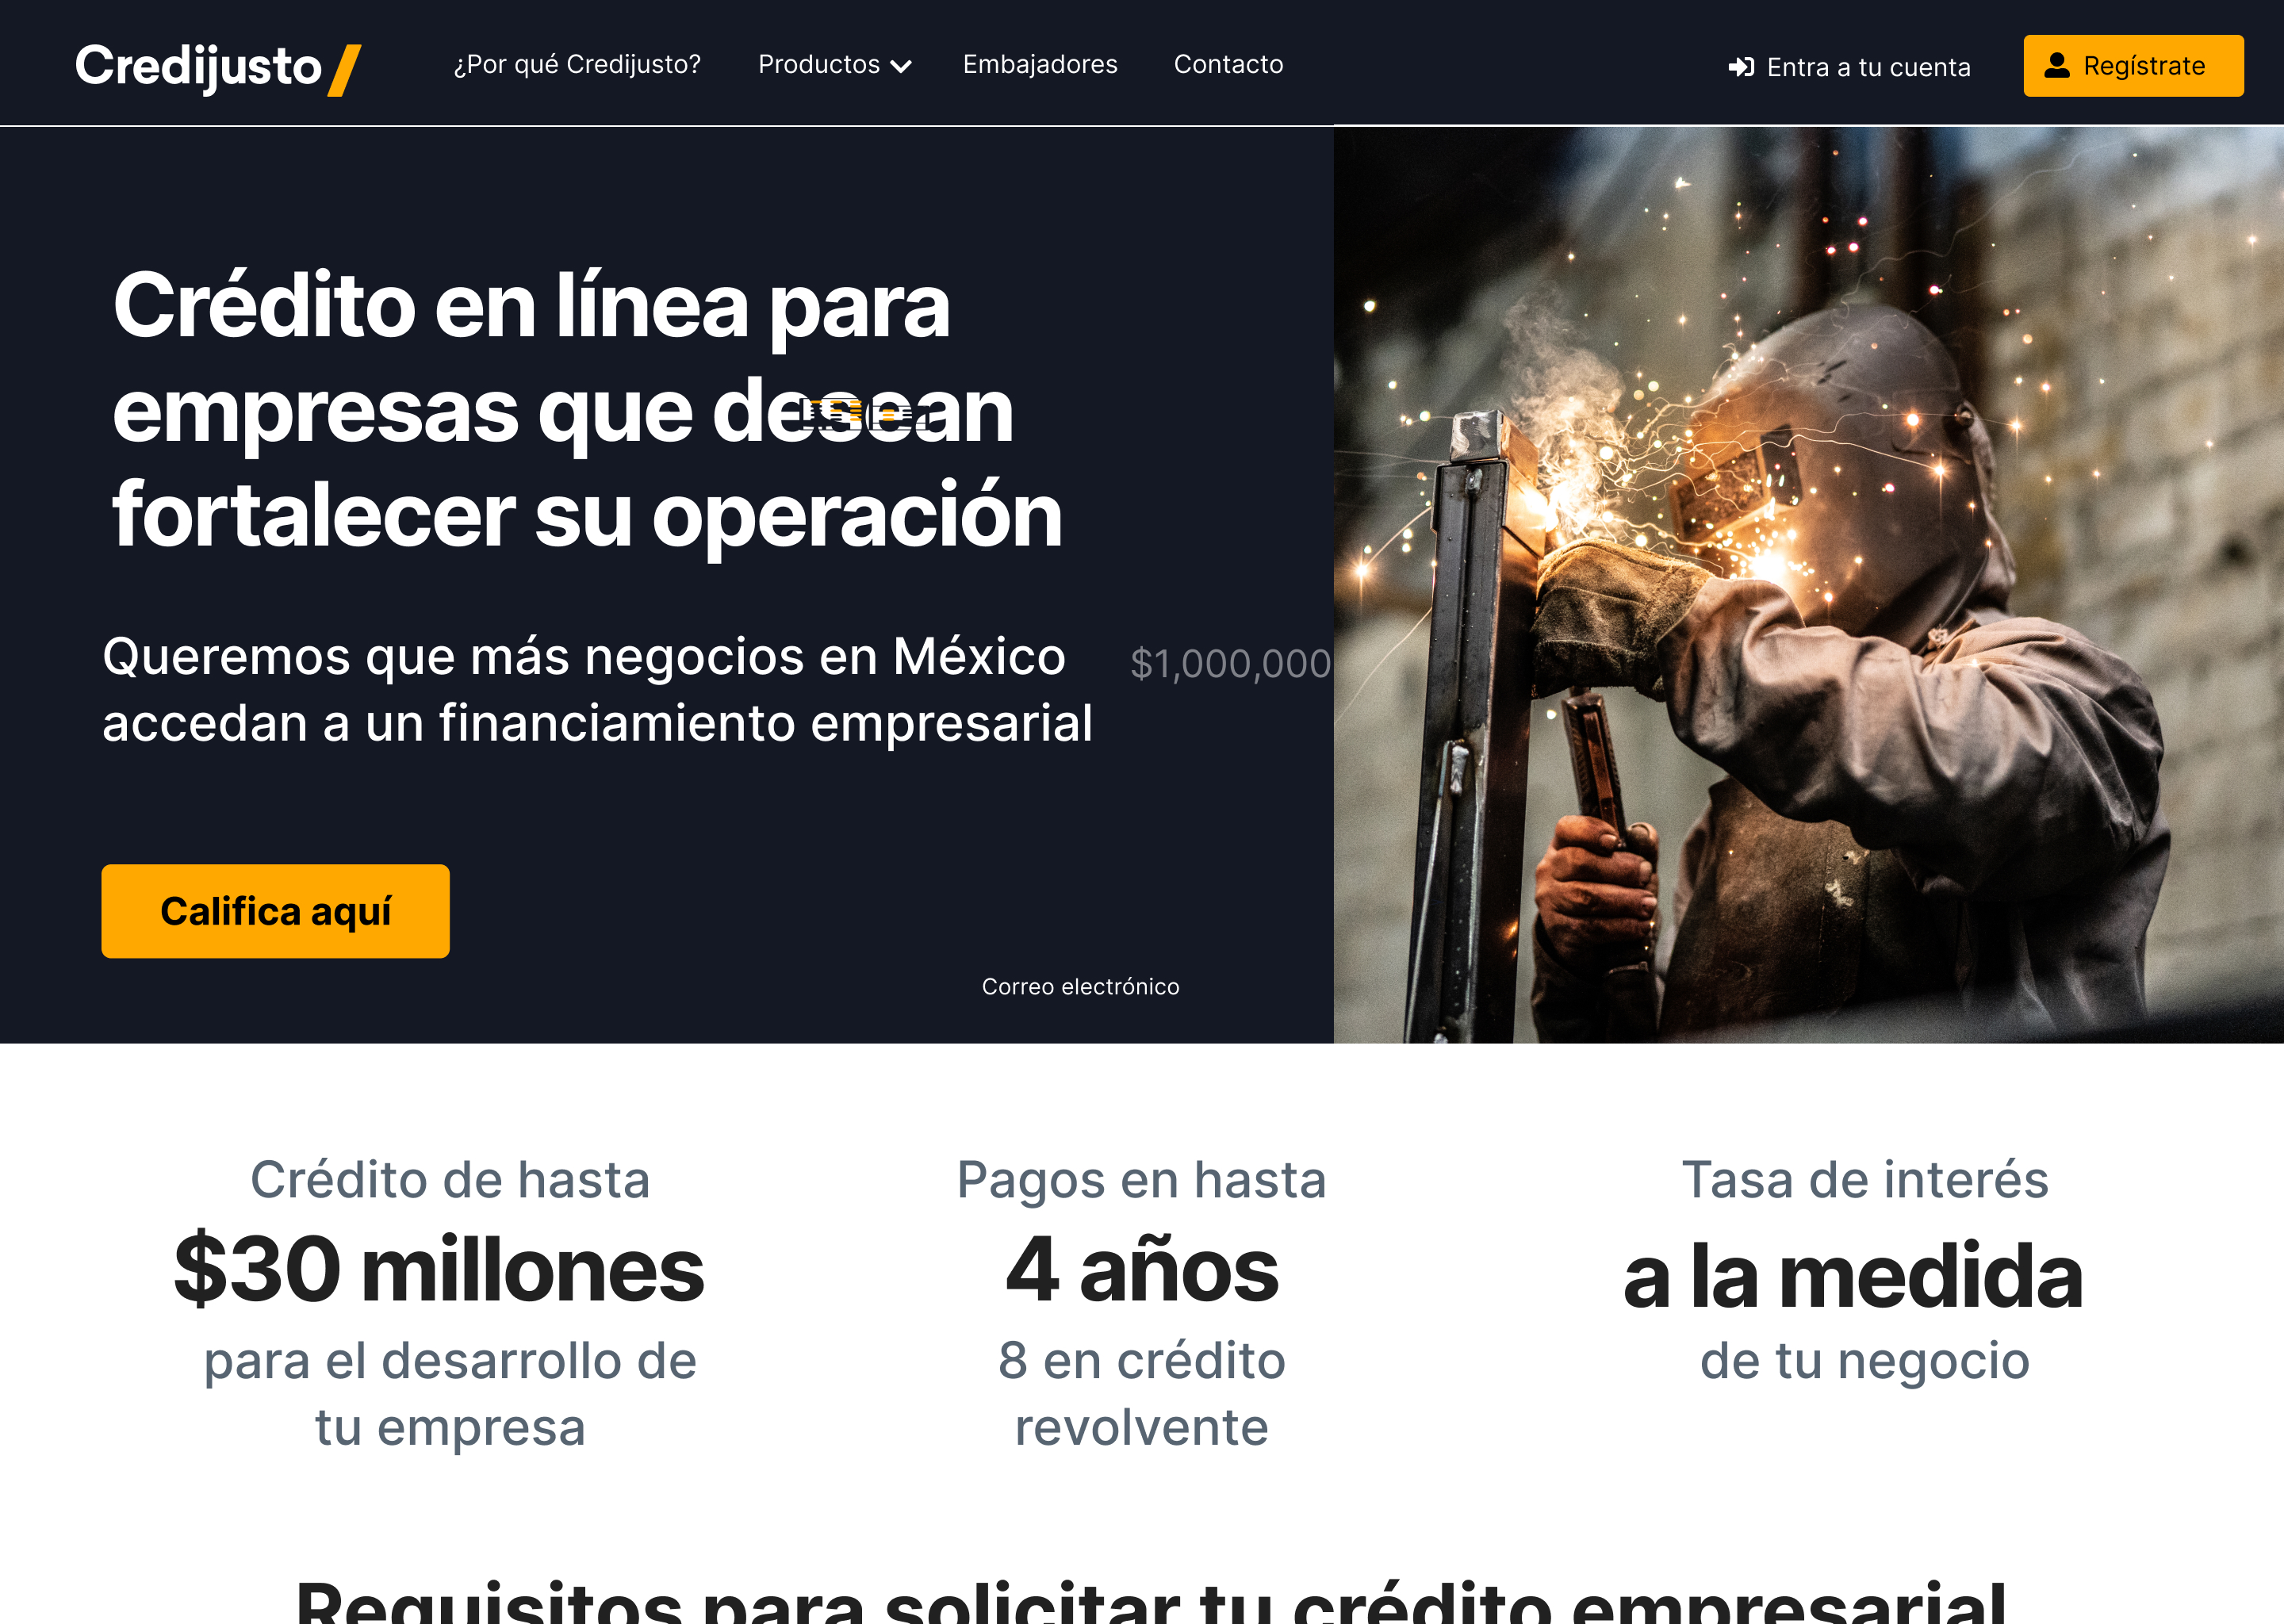
Crédito
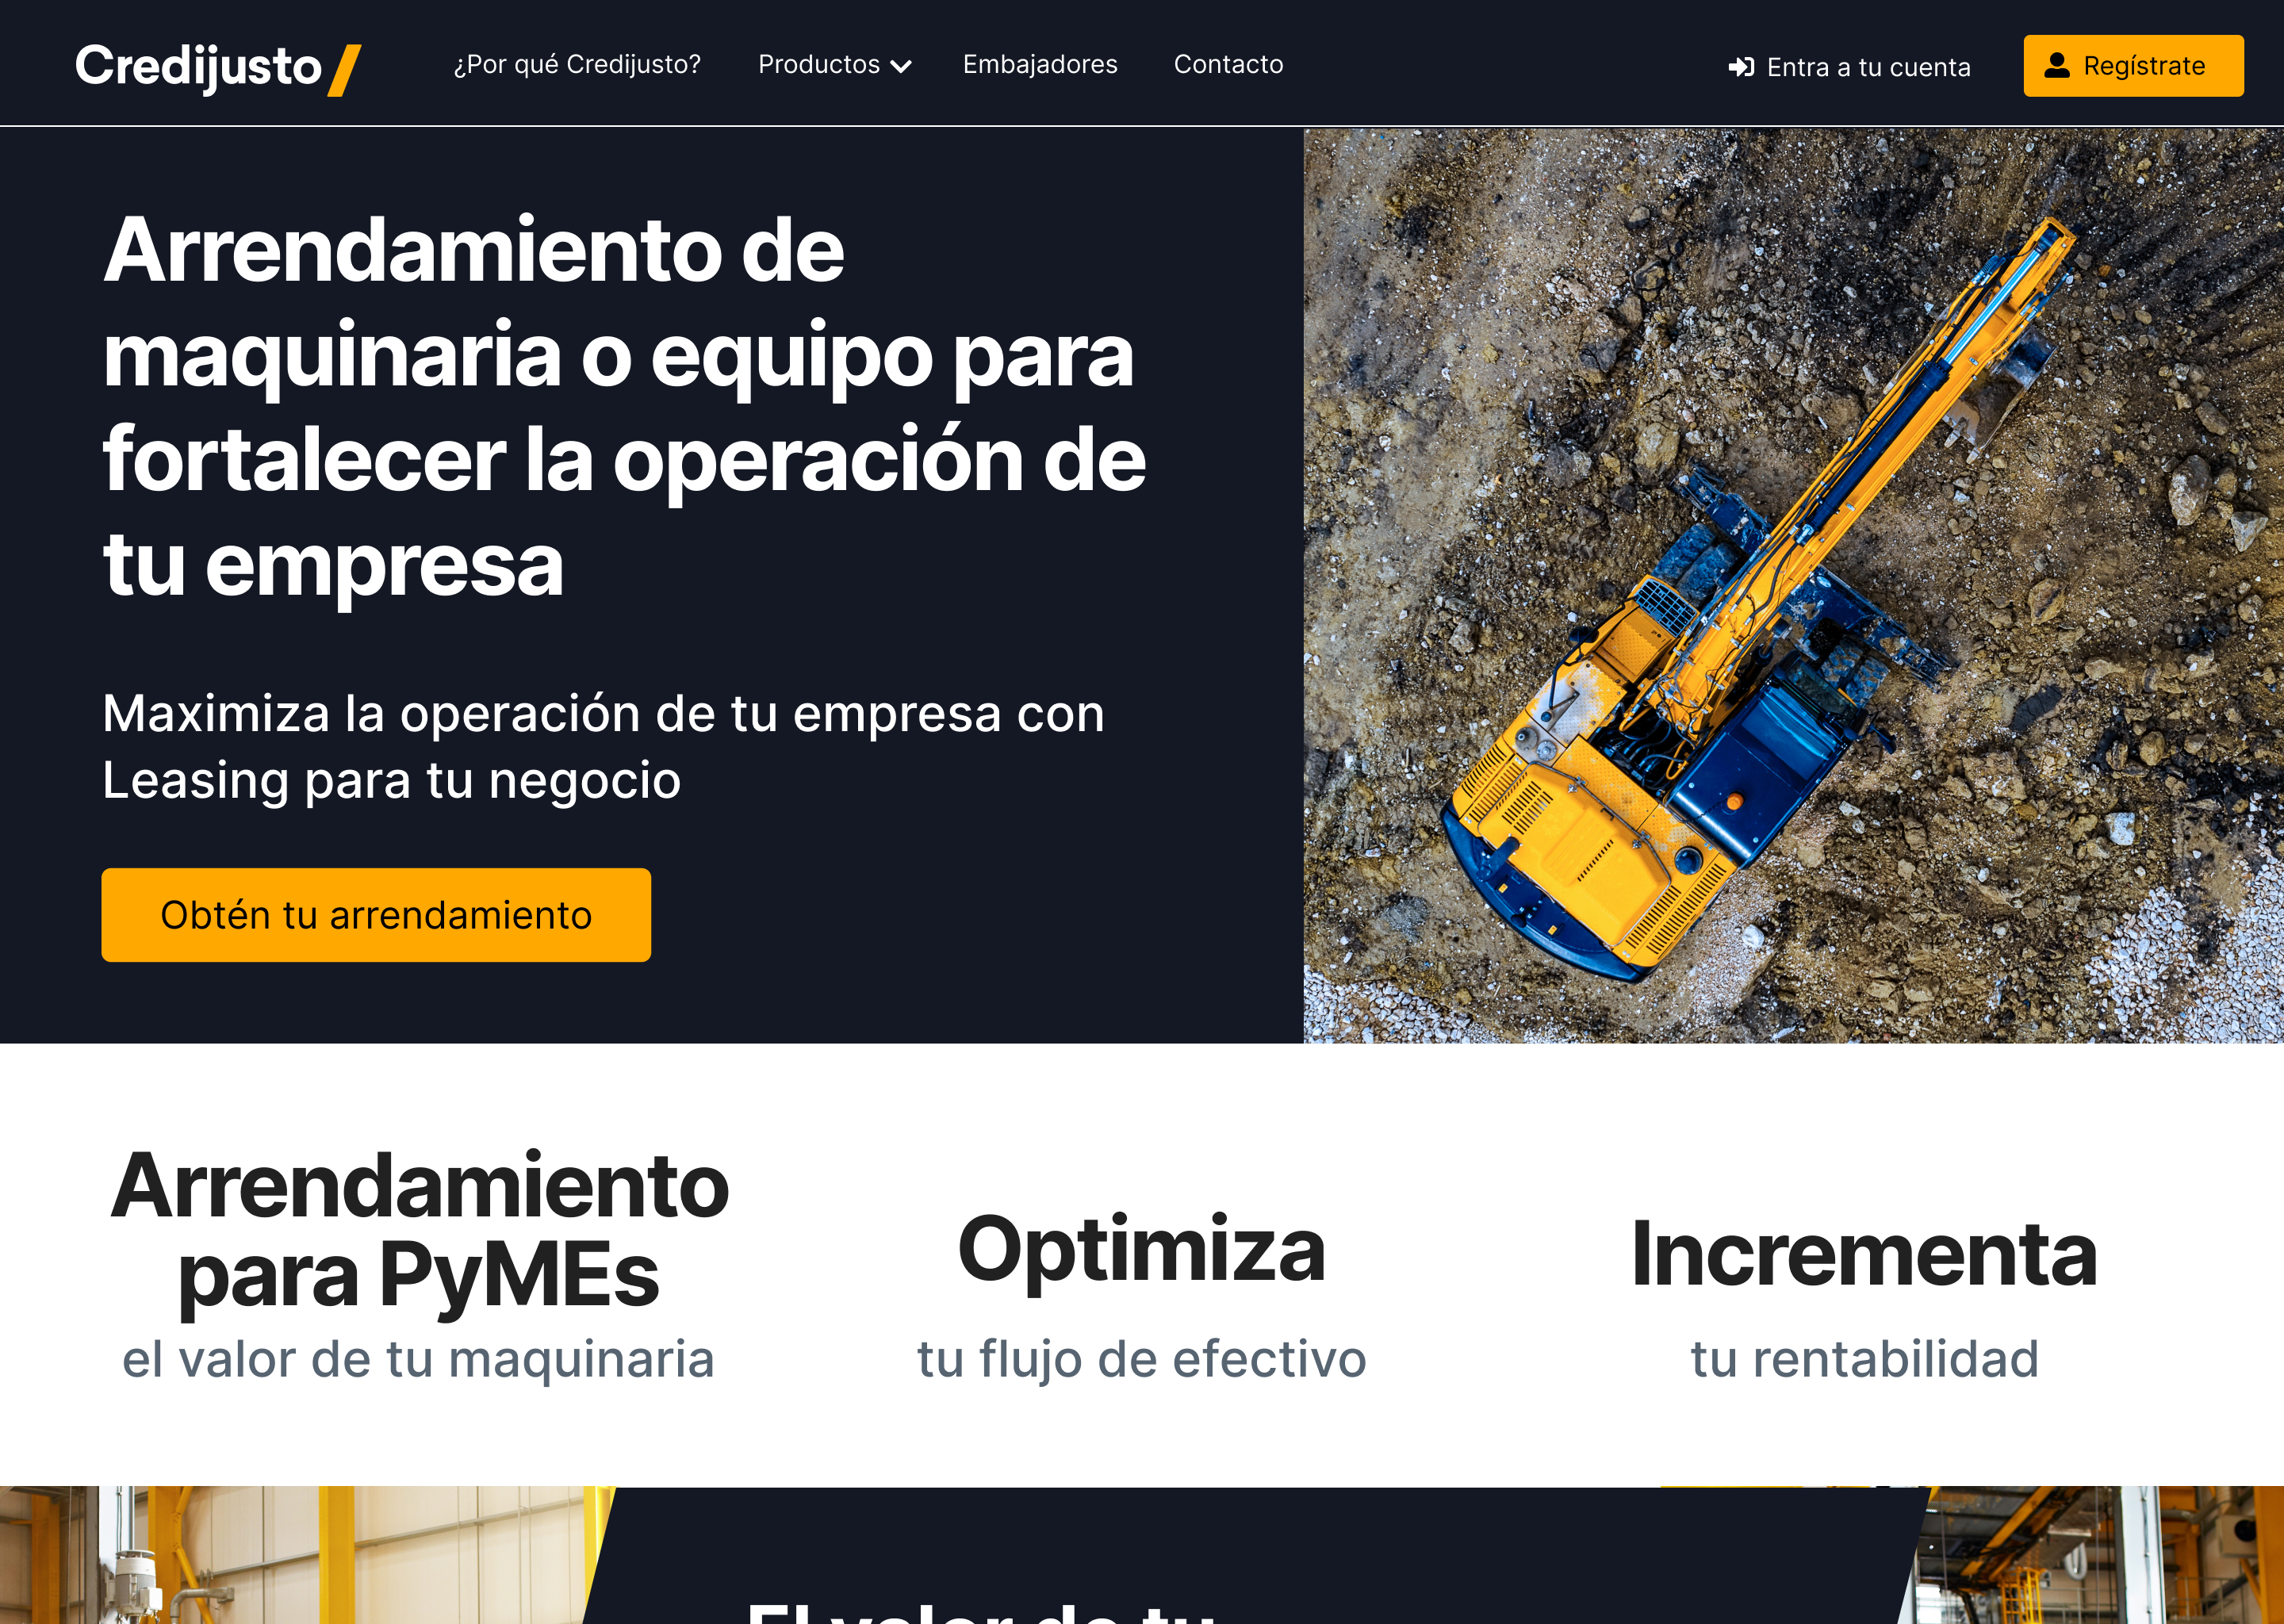
Arrendamiento
Content hierarchy
I interviewed a user and asked them to sort the different pieces of content within different structures. In the end they defined their own website, with their own content priorities. I then built a content matrix with the marketing team, which also became a way to share UX terms with them.
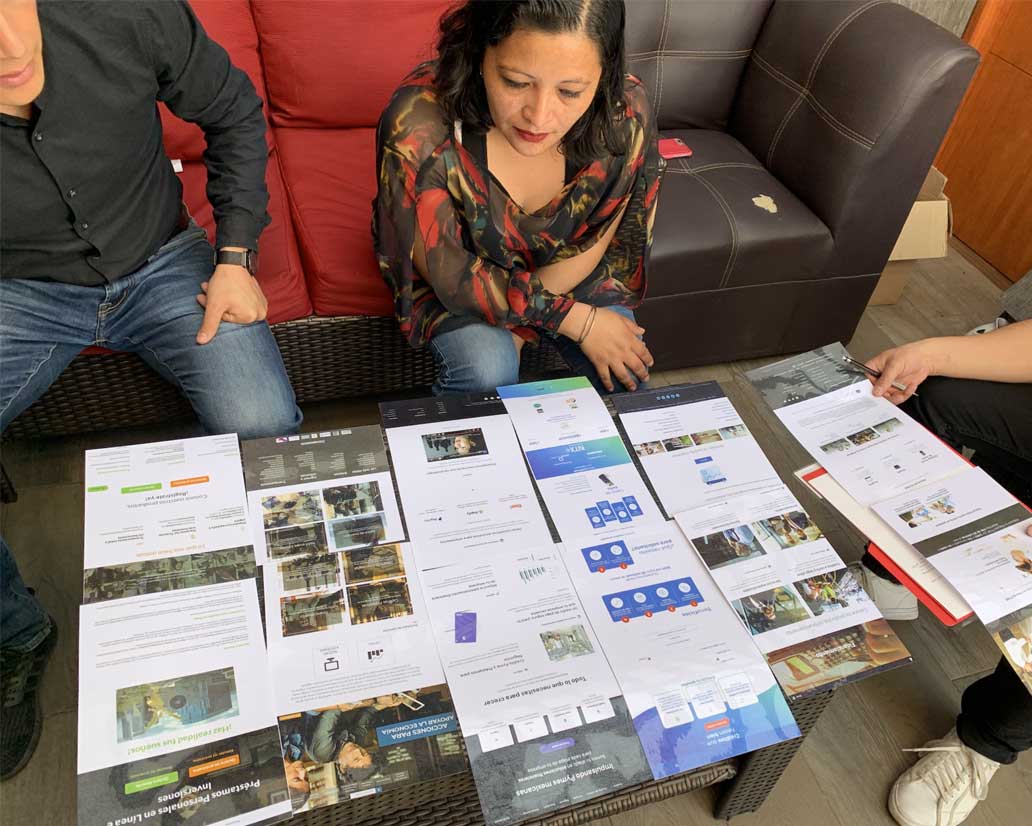
The session with printed wireframes and screens.
From sketches to a first release

First iterations.
Using Figma, I turned my first sketches into low-fidelity wireframes. Then I added a few stock images and the copy that marketing gave me, until the wireframes were solid enough to test. After four tests I made a few changes and moved on to high-fidelity prototypes. Two of them: I made the header banner shorter, because users weren't scrolling and thought it was only a banner. And I changed the main button from "Califica aquí" to "Obtén tu financiamiento", because users found "Califica" a little rude, like an evaluation, and didn't like it.
We planned two releases. The first was about stabilizing the site: information architecture, main flows and mockups, content strategy for SEO and SEM, and assets and content delivery. The second was about metrics: polls, heatmaps and A/B testing.
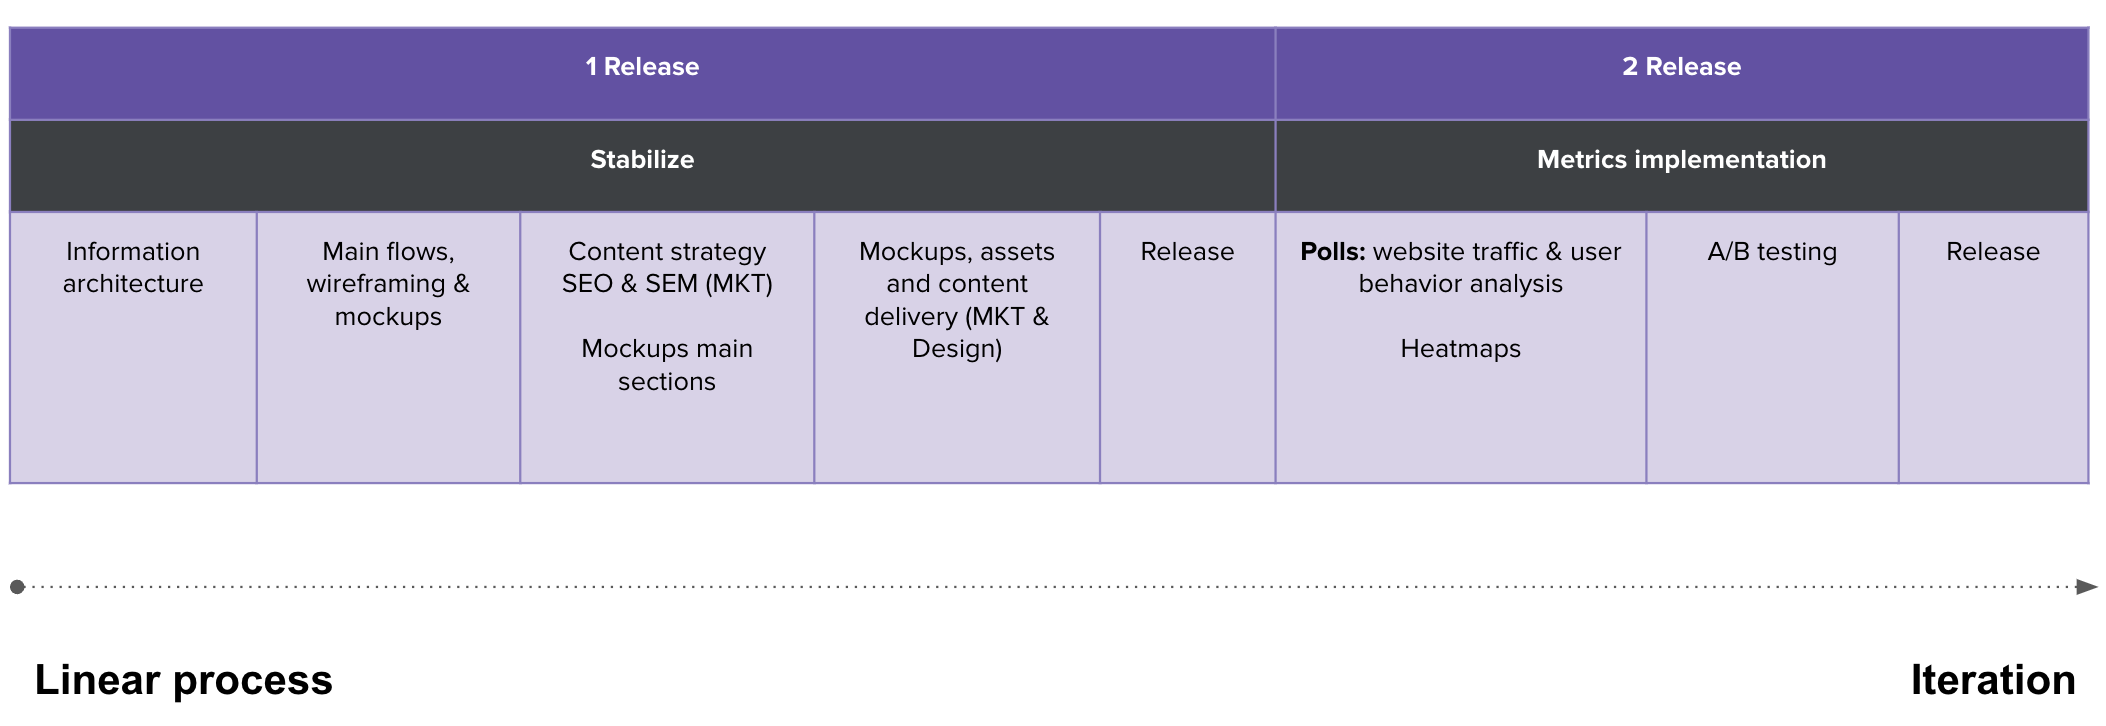 Plan for two releases. Release 1, Stabilize, is a linear process: information architecture; main flows, wireframing and mockups; content strategy, SEO and SEM (marketing) plus mockups of the main sections; mockups, assets and content delivery (marketing and design); then release. Release 2, Metrics implementation, is iteration: polls on website traffic and user behavior analysis plus heatmaps; A/B testing; then release. A timeline arrow below runs from Linear process to Iteration.
What users and the data told me
The first launch was a success, but a site like this needs to be stabilized and measured to get better, so I used polls, surveys and a Google Analytics assessment.
Poll respondents rated how hard the credit request form was at 25 out of 100. The open comments explained it. People couldn't find where to enter data they didn't have, like an SAT registration or an email, and the form gave them no way around it. That turned "the form feels hard" from a hunch into a fix. It wasn't a trust problem: the site scored 66 out of 100 on credibility.
The polls also showed the words the audience uses: credit versus loan, expansion versus strength, growth versus entrepreneurship. I shared them with marketing so they could test content and keywords, and we saw a chance to use a landing page that filters out visitors who don't match Credijusto's offer.
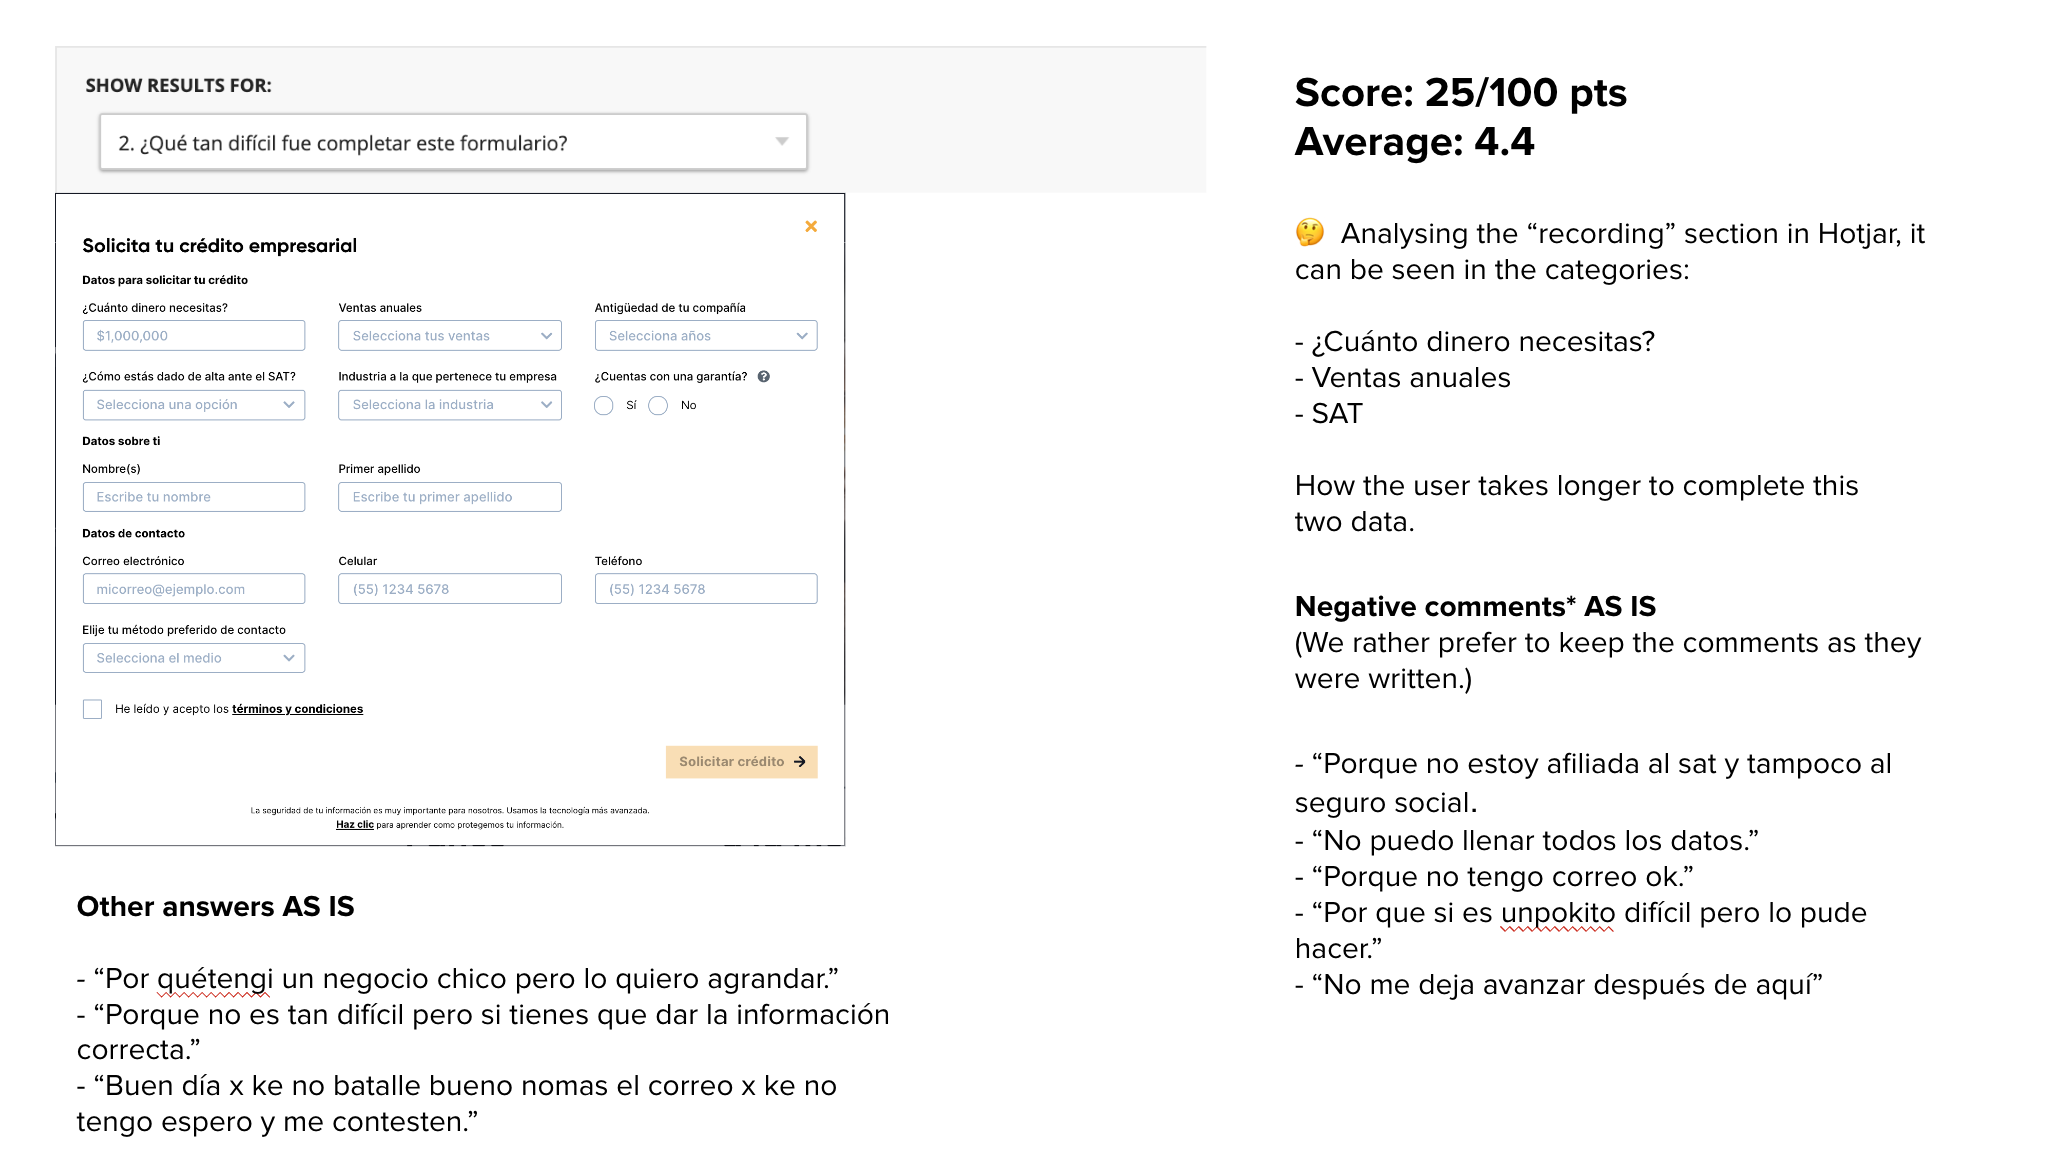 Slide on Hotjar poll results for question 2, how hard was it to complete this form, next to a screenshot of the Solicita tu crédito empresarial form (amount needed, annual sales, company age, tax registration, industry, collateral, name, contact details, preferred contact method, a terms checkbox and a disabled Solicitar crédito button). Score: 25 out of 100 points, average 4.4. In the Hotjar recordings, users take longer on three fields: how much money you need, annual sales and SAT (tax registration). Negative comments, kept as written in Spanish, include not being registered with the SAT or social security, not being able to fill in all the data, not having a working email, and not being able to move on after this step. Other answers say it is a bit hard but doable, or that they have a small business they want to grow.
Example of poll results.
The analytics told a harder story. Average page load was 8.64 seconds, and 9.06 in Chrome, against a recommended ceiling of 3. 57% of visitors abandon a site that takes longer than that. Our keywords were low quality, which hurt the funnel, and over half of the traffic landed on a 320px screen that neither legacy page was designed for.
What changed
The rebuilt site didn't shrink a ten-day quote into six minutes overnight, but it took apart a lot of the friction behind it. Conversion rate went from 0.06% to 1.66%, even though total sessions dropped by about two thirds (the second period had almost three times less traffic). I'd traded raw traffic for qualified leads. Bounce rate fell from 79.36% to 64.43%, and total conversions still grew nearly 9x.
I treated these numbers as hypotheses. Most of the traffic was paid in both periods (80.54% and 79.62%), but the spend was used better in the second one, and targeted campaigns for different products and types of users could lower bounce further and raise conversion. Then we'd start again.
One design system now backs every product built on top of it, so a new feature doesn't mean solving a problem another team already solved. When Credijusto and the bank both became Covalto, the same components carried straight into new production pages instead of being rebuilt.
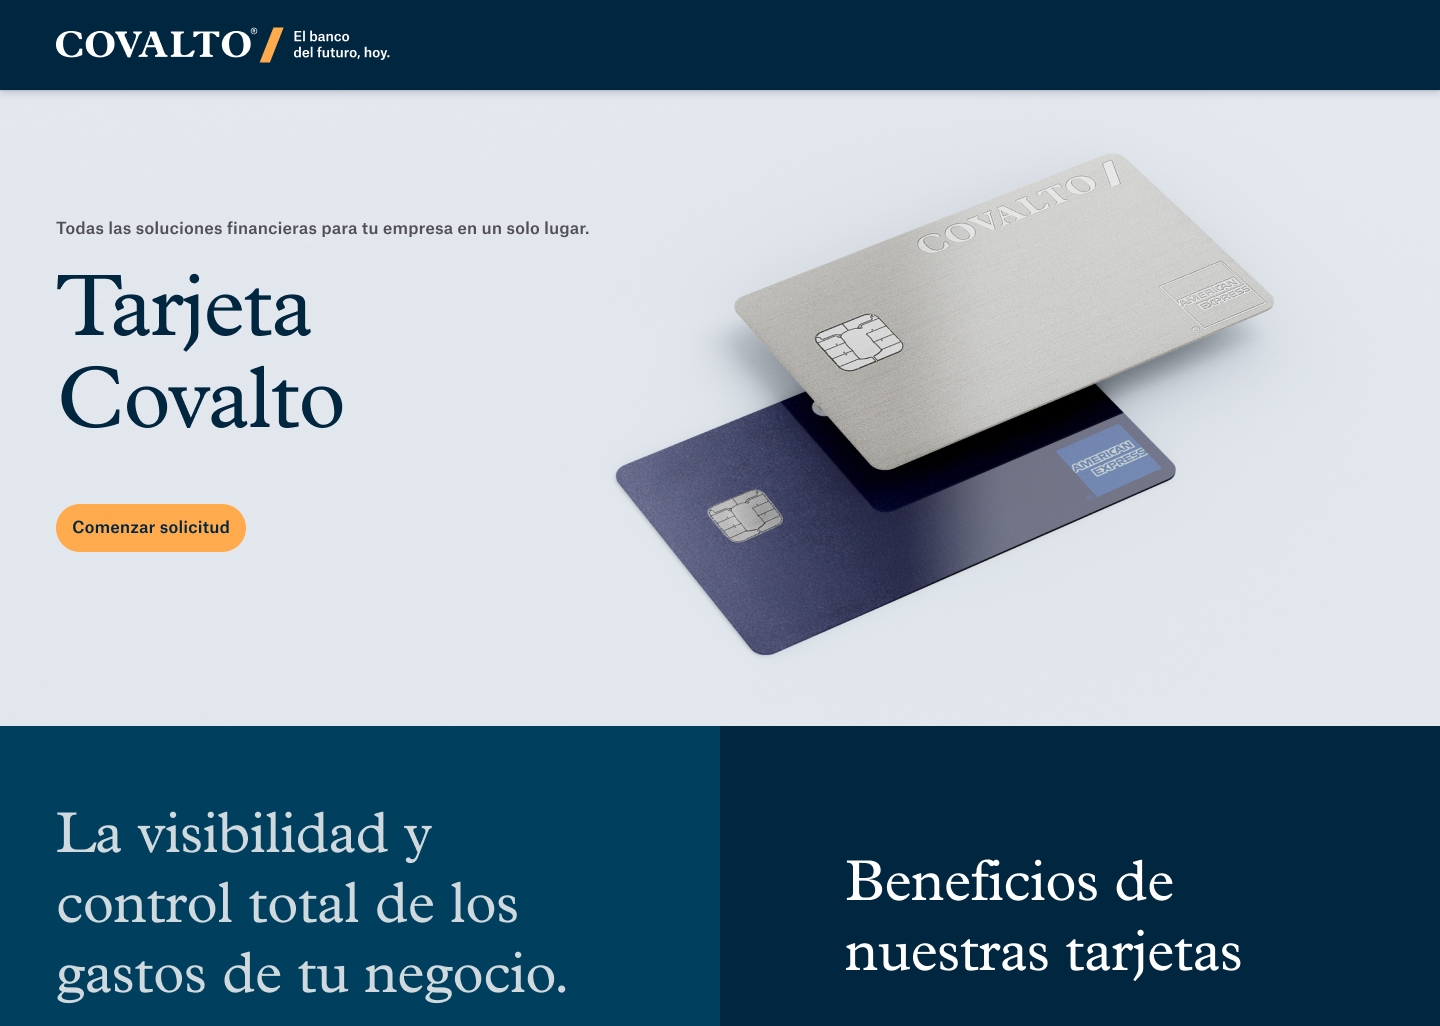
Tarjeta Covalto
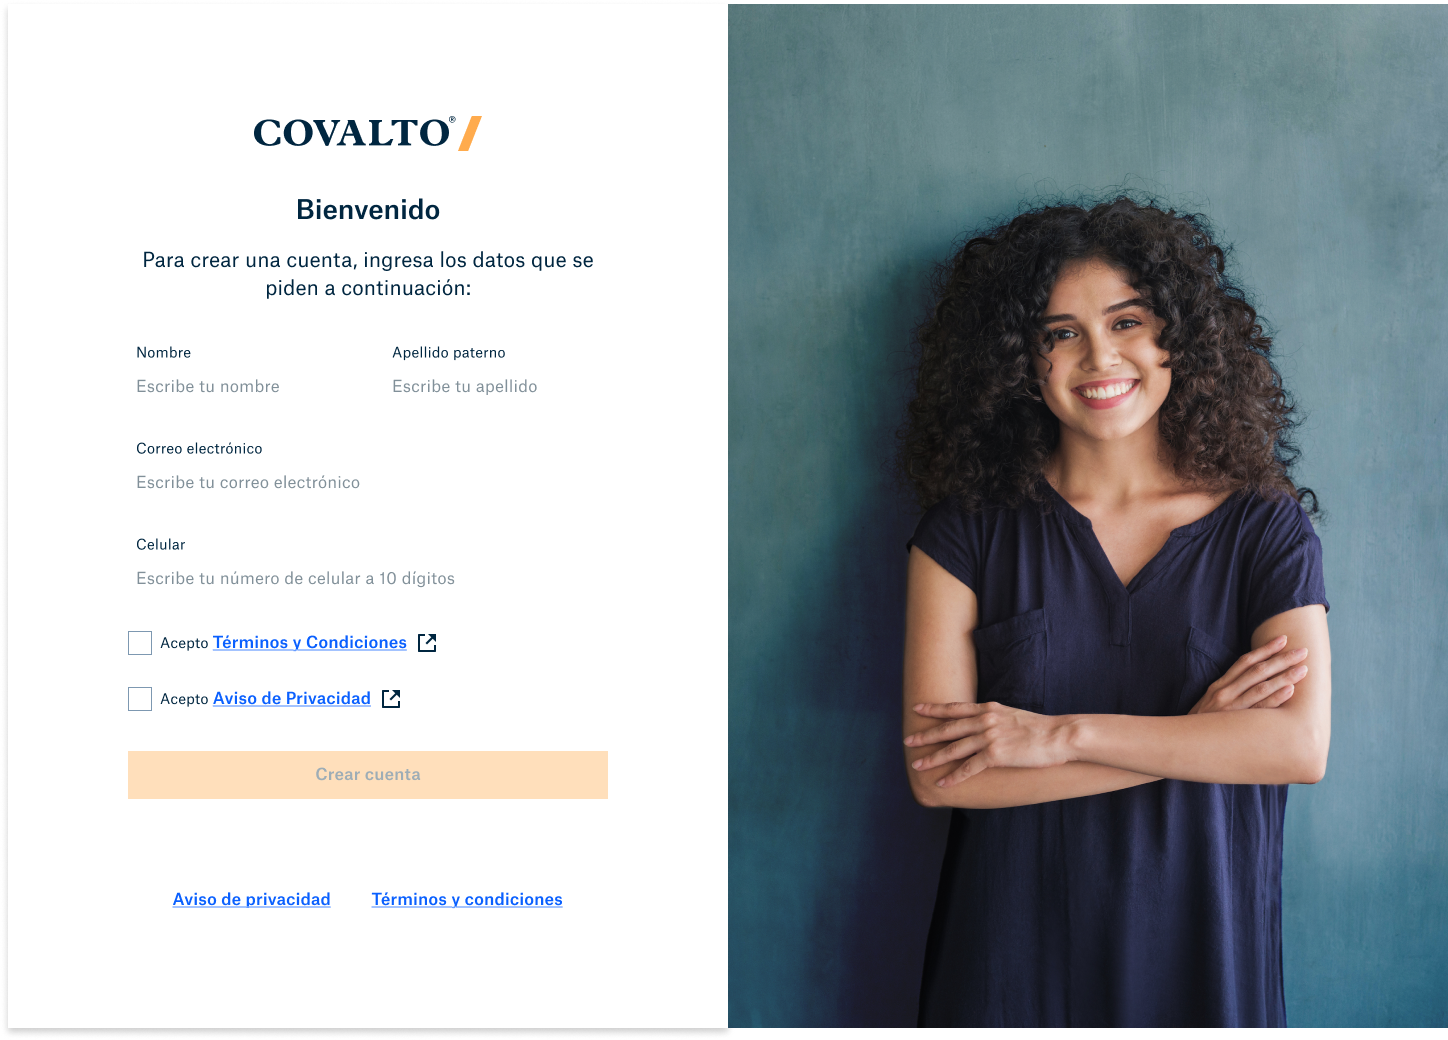
Sign up
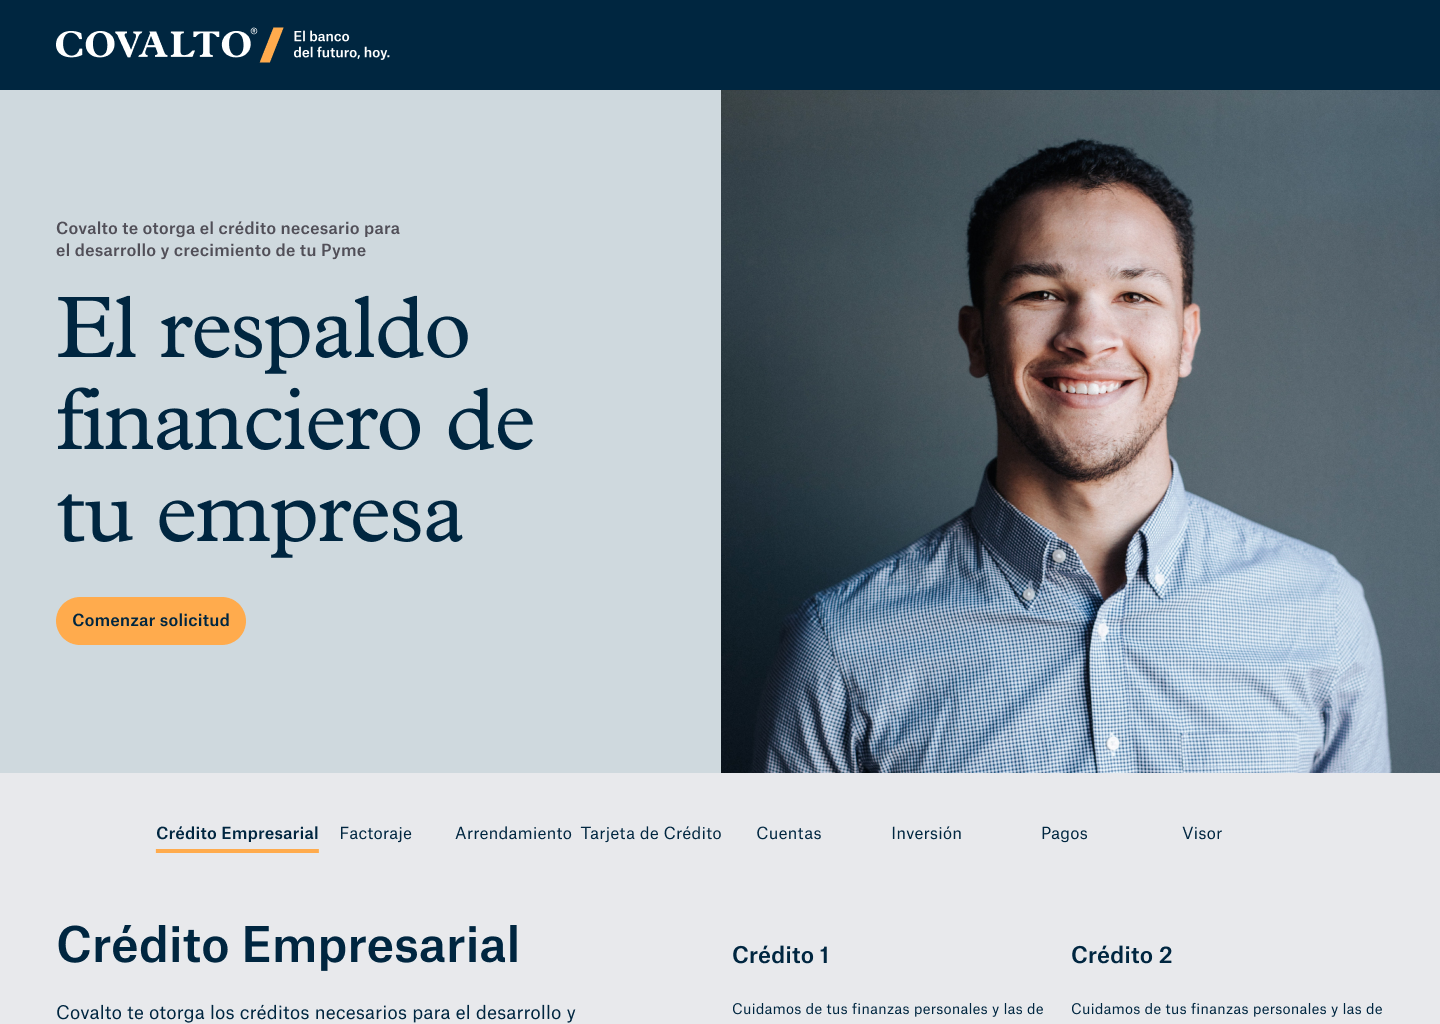
Crédito Empresarial
What I learned
A site like this is never finished. You have to improve it every time. Convincing stakeholders to take a direction was hard, but not impossible, and the shadowing and surveys helped because they gave everyone the same list of customer pain points. If I could change one thing, I'd run more user tests, because that's where I learn the most. Next I wanted screen recordings in Hotjar on key pages, a calendar for when to record and review, and CES polls to see how much effort each touchpoint takes.
Thanks for reading.